Over the past few months, Neovim has become my go-to editor for all of my free time/side project coding needs. There have certainly been hurdles to overcome, but I enjoy the experience and coding environment that Neovim provides. As I've continued to expand my Neovim understanding and environment configuration, I've been looking for more and more ways to integrate Neovim into my .NET development workflow. I've written a couple of posts about .NET development in Neovim. One for general environment setup and another for Roslyn/.editorconfig integration. If you don't have your local development environment for Neovim setup yet, I would highly recommend checking out those posts. With all of that in place, we should be ready to configure Neovim for the ability to run our application with a debugger.
First, I think it's valuable to talk about the plugin that makes this all possible. The only plugin that we need to install for debugging in Neovim is nvim-dap. I would highly recommend reading more about nvim-dap in the GitHub repo, but at a very high-level nvim-dap is a debug adapter protocol client implementation for Neovim. Nvim-dap provides the ability to run an application with a debugger, add breakpoints, step through code, inspect scopes, and much more. Neovim 0.8.0 is the recommended version for using nvim-dap, but the nightly build and 0.7.2 are also supported. Nvim-dap is a generic implementation than can plug into almost any debugger that follows the standard protocol. For this post, we are going to be focused on the use of nvim-dap for debugging .NET applications. Let's start with a list of steps that need we'll be going through.
- Install nvim-dap plugin
- Install netcoredbg adapter
- Configure nvim-dap to use netcoredbg
- Install and configure dapui
- Debug our apps 😎
Install nvim-dap
Nvim-dap can be installed just like any other Neovim plugin. I use Packer for plugin management so the install command looks like this. For the full installation, documentation check out the README here
mfussenegger/nvim-dap'
Install netcoredbg
We now have nvim-dap installed, but to make it useful for .NET development we need to install a debug adapter. In this case, the adapter is netcoredbg. For installation, we can go to the releases page and download the latest release. At the time of writing the latest release is 2.2.0-947.

Once downloaded we need to unzip and move the netcoredbg executable and dependencies to a permanent location. I'm currently developing on a Mac and I chose /usr/local/bin/netcoredbg. Now we need to do a few things to make sure we can run the executable. First, we can run chmod 744 /usr/local/bin/netcoredbg/* to allow the current user to execute the files inside of netcoredbg. We also need to remove the quarantine label from the files since they were downloaded from the internet and Apple will not allow them to be run by default. I did this by running find /usr/local/bin/netcoredbg/* | xargs xattr -r -d com.apple.quarantine.

Configure nvim-dap
We now have nvim-dap and netcoredbg installed and are ready to configure nvim-dap to use netcoredbg. This step is very straightforward. The following code can be added to a lua block in init.vim or directly in a lua file that is part of the Neovim runtime path. I think the only dynamic piece of the code is to make sure the command field is referencing the correct location for the netcoredbg executable.
local dap = require('dap')

dap.adapters.coreclr = {
  type = 'executable',
  command = '/usr/local/bin/netcoredbg/netcoredbg',
  args = {'--interpreter=vscode'}
}

dap.configurations.cs = {
  {
    type = "coreclr",
    name = "launch - netcoredbg",
    request = "launch",
    program = function()
        return vim.fn.input('Path to dll', vim.fn.getcwd() .. '/bin/Debug/', 'file')
    end,
  },
}
With all of this done we now have a functioning debugging adapter for .NET Core applications in Neovim. With that being said the developer experience in the current state is a little clunky. We haven't set up any keymaps to perform actions like starting the debugger and setting breakpoints. We will go through that next, but if you'd like to give debugging a shot you should be able to run :lua require'dap'.continue(), which will prompt for the path to the .dll file to debug. Before going any further let's set up the keymaps for nvim-dap.
nnoremap <silent> <F5> <Cmd>lua require'dap'.continue()<CR>
nnoremap <silent> <F10> <Cmd>lua require'dap'.step_over()<CR>
nnoremap <silent> <F11> <Cmd>lua require'dap'.step_into()<CR>
nnoremap <silent> <F12> <Cmd>lua require'dap'.step_out()<CR>
nnoremap <silent> <Leader>b <Cmd>lua require'dap'.toggle_breakpoint()<CR>
nnoremap <silent> <Leader>B <Cmd>lua require'dap'.set_breakpoint(vim.fn.input('Breakpoint condition: '))<CR>
nnoremap <silent> <Leader>lp <Cmd>lua require'dap'.set_breakpoint(nil, nil, vim.fn.input('Log point message: '))<CR>
nnoremap <silent> <Leader>dr <Cmd>lua require'dap'.repl.open()<CR>
nnoremap <silent> <Leader>dl <Cmd>lua require'dap'.run_last()<CR>
As you can see from the remapping <leader>b is used to toggle breakpoints and F5 is used to launch the debugger. In the screenshot below you can see there is a breakpoint denoted by the B in the lefthand gutter as well as the path to EplStats.dll in the status bar at the bottom of the window.

We are now at a point where the debugging experience is fully-featured, but maybe a little raw still. Next, we're going to configure the dapui plugin which will provide a more familiar debugging experience from a UI perspective.
Install and configure dapui
The dapui plugin is installed like any other Neovim plugin, but it is dependent on nvim-dap being installed as well.
use { "rcarriga/nvim-dap-ui", requires = {"mfussenegger/nvim-dap"} }
I think the default setup for dapui is a great starting point for a familiar debugging UI in Neovim with a couple of caveats. In the configuration below there are a few lines at the end that make sure the dapui windows are open and closed when the debugger is launched and terminated. The following snippet can be added to the init.lua, a lua section in init.vim, or another lua file in the runtime path.
local dap, dapui = require("dap"), require("dapui")
dapui.setup({
icons = { expanded = "▾", collapsed = "▸", current_frame = "▸" },
mappings = {
-- Use a table to apply multiple mappings
expand = { "<CR>", "<2-LeftMouse>" },
open = "o",
remove = "d",
edit = "e",
repl = "r",
toggle = "t",
},
-- Use this to override mappings for specific elements
element_mappings = {
-- Example:
-- stacks = {
-- open = "<CR>",
-- expand = "o",
-- }
},
-- Expand lines larger than the window
-- Requires >= 0.7
expand_lines = vim.fn.has("nvim-0.7") == 1,
-- Layouts define sections of the screen to place windows.
-- The position can be "left", "right", "top" or "bottom".
-- The size specifies the height/width depending on position. It can be an Int
-- or a Float. Integer specifies height/width directly (i.e. 20 lines/columns) while
-- Float value specifies percentage (i.e. 0.3 - 30% of available lines/columns)
-- Elements are the elements shown in the layout (in order).
-- Layouts are opened in order so that earlier layouts take priority in window sizing.
layouts = {
{
elements = {
-- Elements can be strings or table with id and size keys.
{ id = "scopes", size = 0.25 },
"breakpoints",
"stacks",
"watches",
},
size = 40, -- 40 columns
position = "left",
},
{
elements = {
"repl",
"console",
},
size = 0.25, -- 25% of total lines
position = "bottom",
},
},
controls = {
-- Requires Neovim nightly (or 0.8 when released)
enabled = true,
-- Display controls in this element
element = "repl",
icons = {
pause = "",
play = "",
step_into = "",
step_over = "",
step_out = "",
step_back = "",
run_last = "↻",
terminate = "□",
},
},
floating = {
max_height = nil, -- These can be integers or a float between 0 and 1.
max_width = nil, -- Floats will be treated as percentage of your screen.
border = "single", -- Border style. Can be "single", "double" or "rounded"
mappings = {
close = { "q", "<Esc>" },
},
},
windows = { indent = 1 },
render = {
max_type_length = nil, -- Can be integer or nil.
max_value_lines = 100, -- Can be integer or nil.
}
})
dap.listeners.after.event_initialized["dapui_config"] = function()
dapui.open()
end
dap.listeners.before.event_terminated["dapui_config"] = function()
dapui.close()
end
dap.listeners.before.event_exited["dapui_config"] = function()
dapui.close()
end
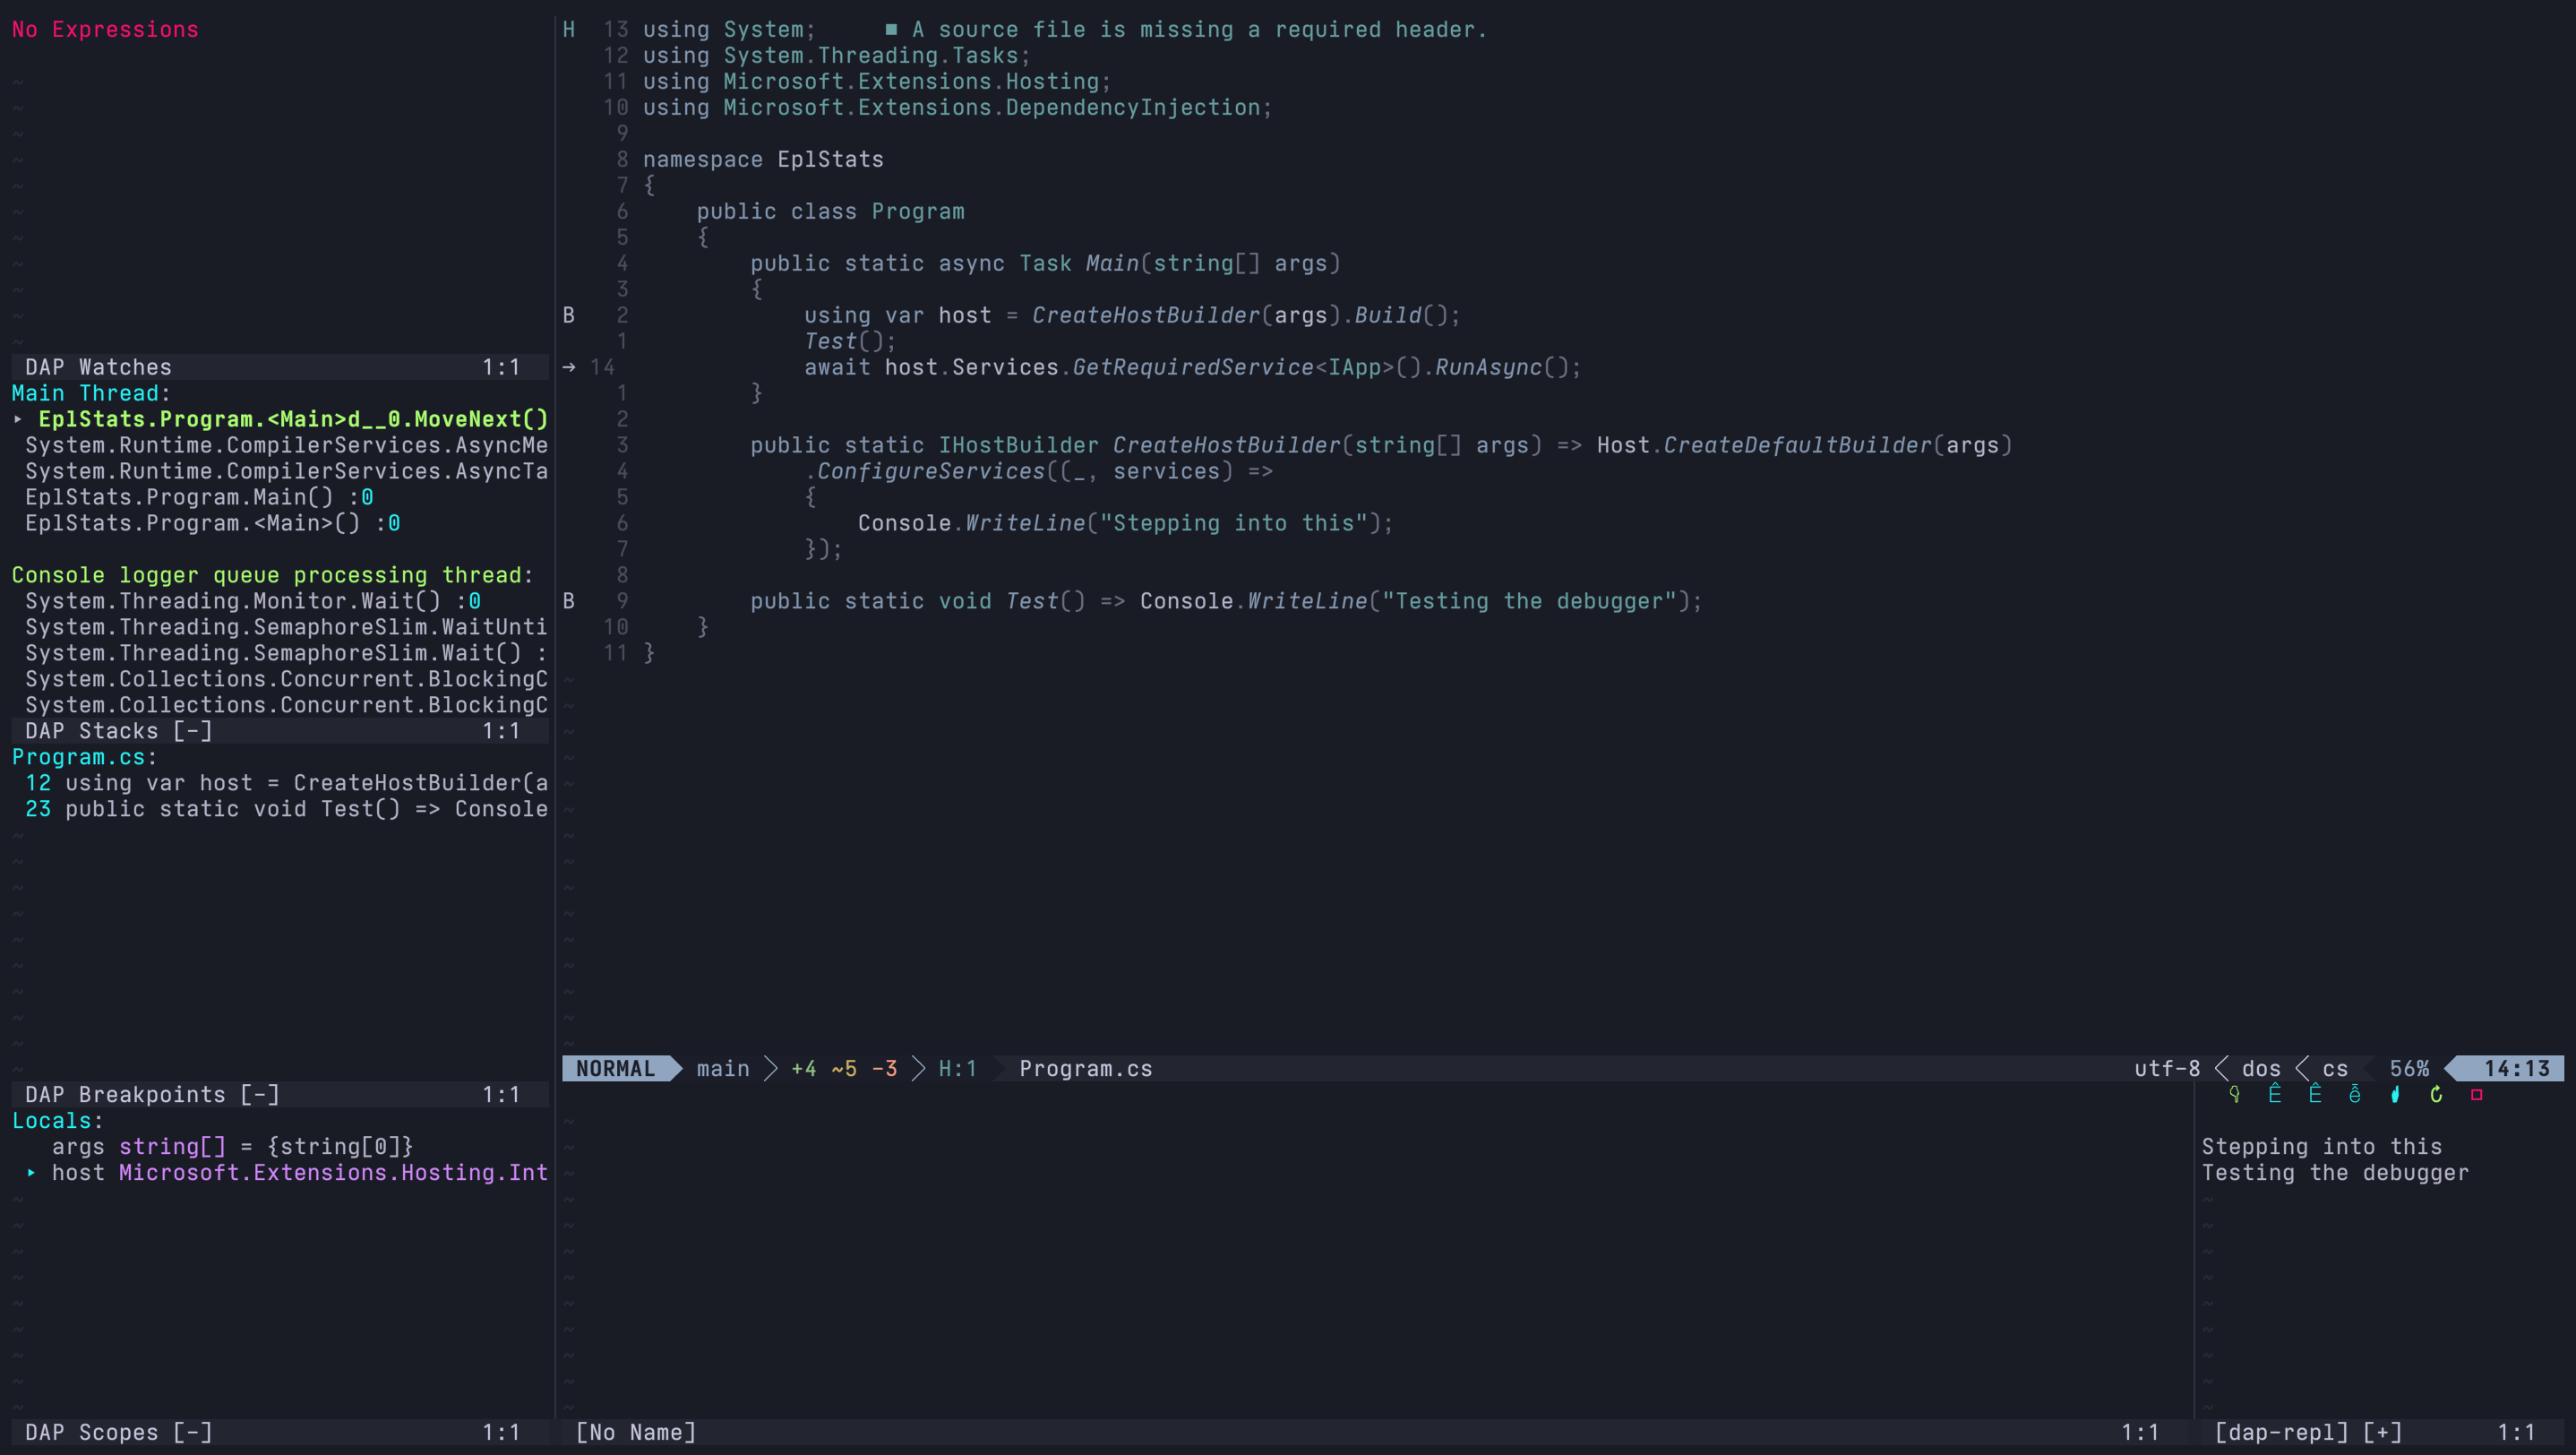
With this configuration in place, when the debugger launches we should see a UI that looks something like this. The default dapui configuration is equipped with call stacks, local scopes, console output, and active breakpoints.
Debugging demo
If you've made it to this point, congratulations! Configuring a debugging environment in this way can be a long process and it's not always straightforward. In the gif below you'll see the debugging experience in action. Notice the arrow in the lefthand gutter, which indicates the current line that the debugger is paused. As you can see from the button press hints, F10 is used to step over and F11 is used to step inside of methods.
This post is a quick and simple introduction to this debugging configuration, but I would highly recommend checking out the documentation for nvim-dap and dapui for more advanced configuration and customization.