Getting Started
Before we get started I highly recommend reading my previous post on configuring your VS Code environment for .NET development here. That post will give you everything you need (and more) to hit the ground running with debugging in VS Code. If you don't want to read that post, just make sure you have the C# extension installed before continuing. That extension provides a lot of the .NET-specific debugging experience that we'll cover in this post.
In this post, we'll be looking at the debug configuration for a .NET 6 Web API project. With that being said much of the topics covered will be relevant for other application types like Console apps. To start let's create a new Web API project using the .NET CLI.
dotnet new webapi -n VsCodeDebugging
When you first open a .NET application in VS Code, you may be shown a prompt to add build and debug assets. If that is the case, select 'Yes'.

Selecting yes to this prompt will add a .vscode directory to the root of your project. I would recommend checking this directory into version control so that your debug and task configuration can be shared with others that work on the repository. Within the .vscode directory a launch.json and tasks.json files will be created and populated with a default configuration to get you up and running. We'll touch on the details of each of these files later in the post.
.vscode
├── launch.json
└── tasks.json
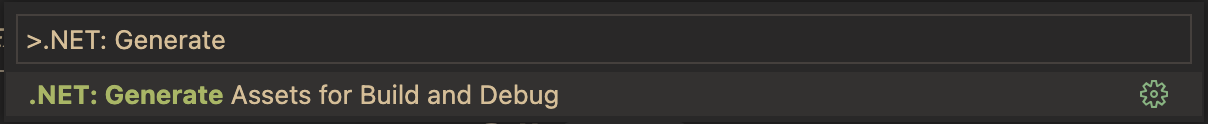
If you accidentally clicked No to the prompt or didn't see the prompt you can always generate the .vscode directory by running .NET: Generate Assets for Build and Debug from the command palette (Cmd + Shift + P).
At this point, if you open the Run and Debug pane or press F5 to run your app with the default configuration, you may be surprised to see that a new browser window is launched with the address bar URL being the root of your project and a 404 error. We'll be going over a few different ways to configure the debug experience, but let's fix this error first.
We'll start by opening up the launch.json file in the .vscode directory. This is the file that contains the different launch configurations for our debugging experience. Since this is an API project it probably doesn't make sense to open up a browser window when we debug the application. To fix this we'll remove the entire "serverReadyAction" object from the JSON.
"serverReadyAction": {
    "action": "openExternally",
    "pattern": "\\bNow listening on:\\s+(https?://\\S+)"
}
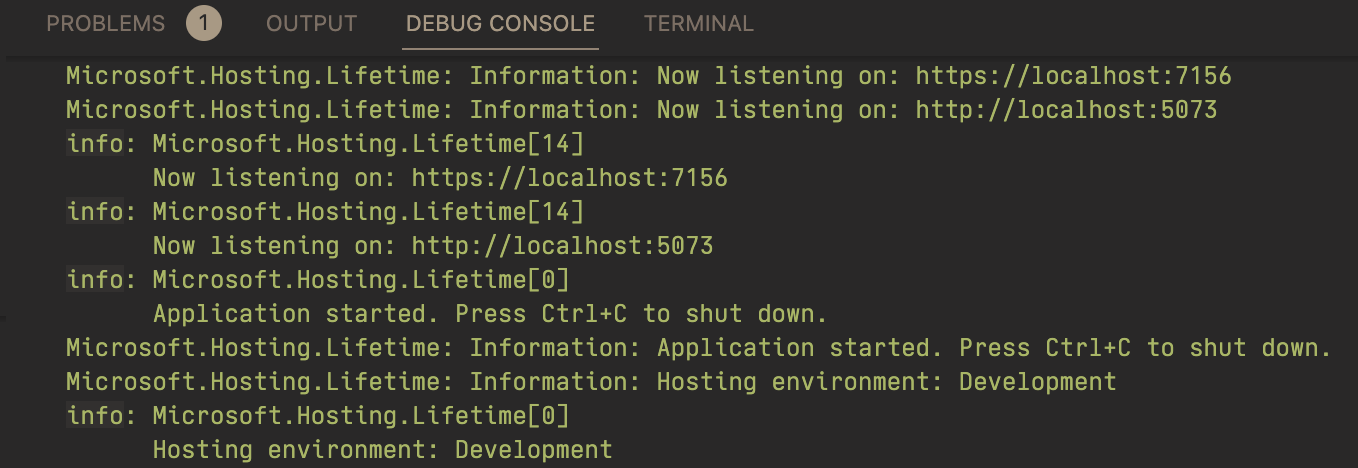
Now when we run our application (press F5 or the play button) we won't see a browser window open but should still see our application startup output in the Debug console.
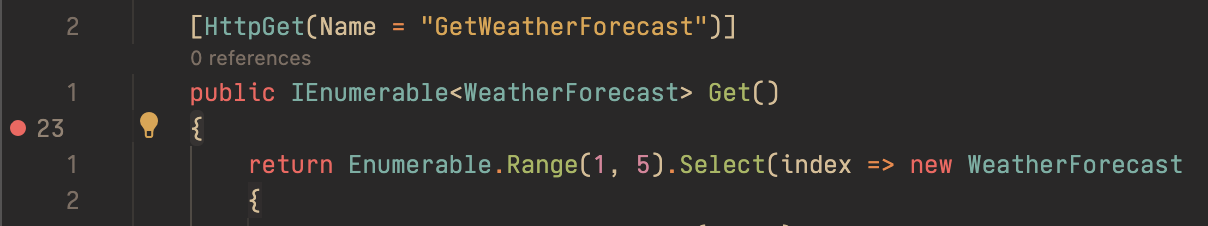
Let's put a breakpoint in the Get method in our controller, which as you can see from the screenshot below is on line 23. In order to hit this breakpoint, we can make a request via a tool like Postman or curl. For the purpose of this example, we'll make the request via curl (the -k flag is to avoid ssl cert error). The port will most likely be different for you, but you can find it by examining the debug output in the Debug console. Once we make the request our application should pause at the breakpoint to begin debugging. A bit later we'll go into some of the VS Code debugging features, but for now, we'll be focusing on configurations.
curl https://localhost:7156/weatherforecast -k
We now have a way to start our application with the debugger running. We'll be going over a couple more scenarios that allow for slightly different experiences.
Other Configurations
Many API projects utilize Swagger or OpenAPI as a way of exposing API endpoints with a UI to improve the ease of manual testing. The first configuration that we'll look at will allow us to automatically debug our application while opening a browser window to the Swagger UI. If you're working with the Web API template that we created at the beginning, you should see a few lines in the Program.cs relating to Swagger and its configuration.
builder.Services.AddEndpointsApiExplorer();
builder.Services.AddSwaggerGen();

var app = builder.Build();

// Configure the HTTP request pipeline.
if (app.Environment.IsDevelopment())
{
    app.UseSwagger();
    app.UseSwaggerUI();
}
Now we'll create a new launch configuration to open up a browser window to the Swagger UI when firing up the debugger. To do this we need to add another object to the configurations array in the launch.json file.
{
    "name": "Launch Swagger",
    "type": "coreclr",
    "request": "launch",
    "preLaunchTask": "build",
    "program": "${workspaceFolder}/VsCodeDebugging/bin/Debug/net6.0/VsCodeDebugging.dll",
    "cwd": "${workspaceFolder}/VsCodeDebugging",
    "stopAtEntry": false,
    "serverReadyAction": {
        "action": "openExternally",
        "pattern": "\\bNow listening on:\\s+https://\\S+:([0-9]+)",
        "uriFormat": "https://localhost:%s/swagger/index.html"
    },
    "env": {
        "ASPNETCORE_ENVIRONMENT": "Development"
    }
},
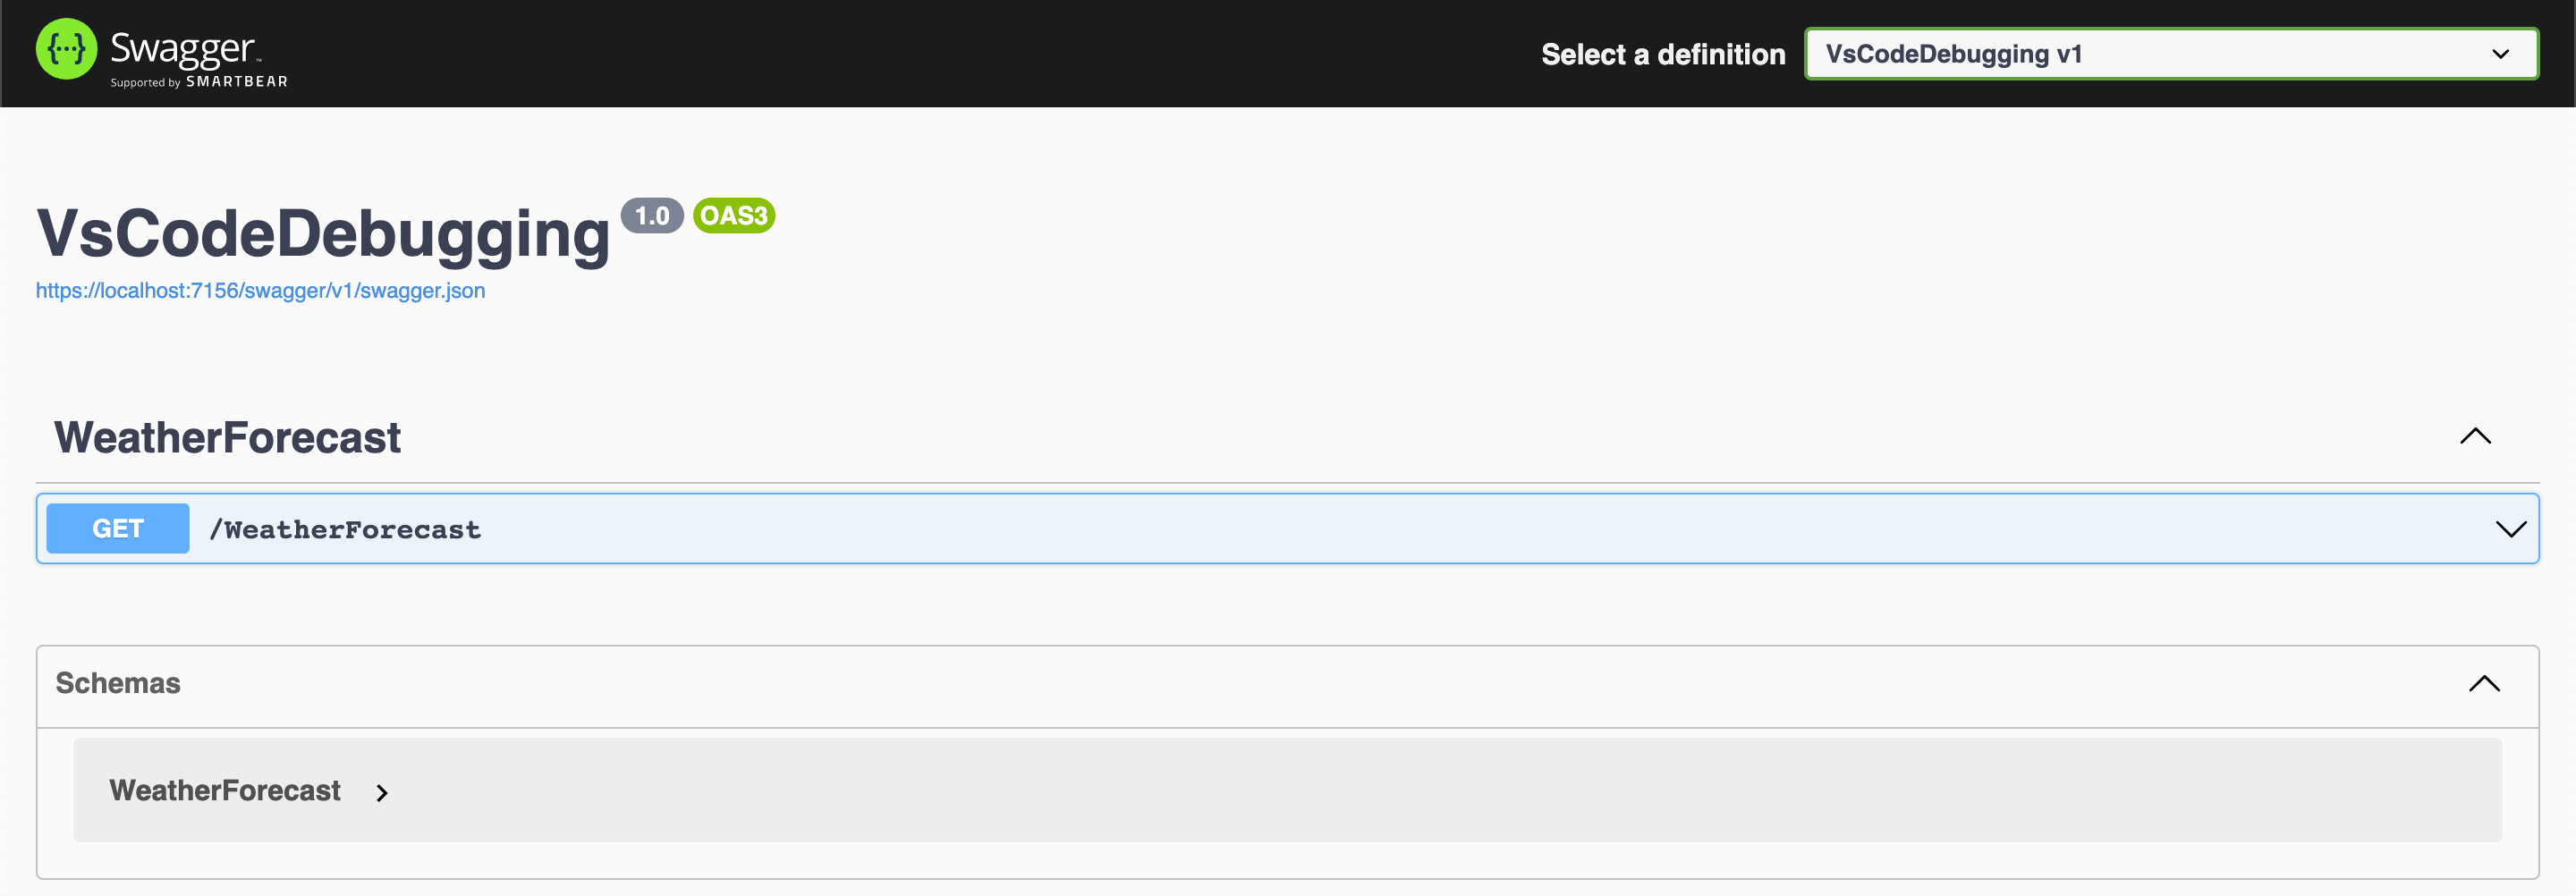
You'll notice that besides the "name" and "serverReadyAction" this launch configuration is the same as the previous one we updated to not launch a browser. By updating the name we can now select this configuration from the dropdown in the Debug and Run pane. The serverReadyAction object is responsible for opening a browser window based on the specified pattern to search in the debug output. In this case, the pattern grabs the port from the debug output and applies it to our uriFormat. If we choose the "Launch Swagger" debug configuration and run the application we should see our Swagger UI open up in the browser.
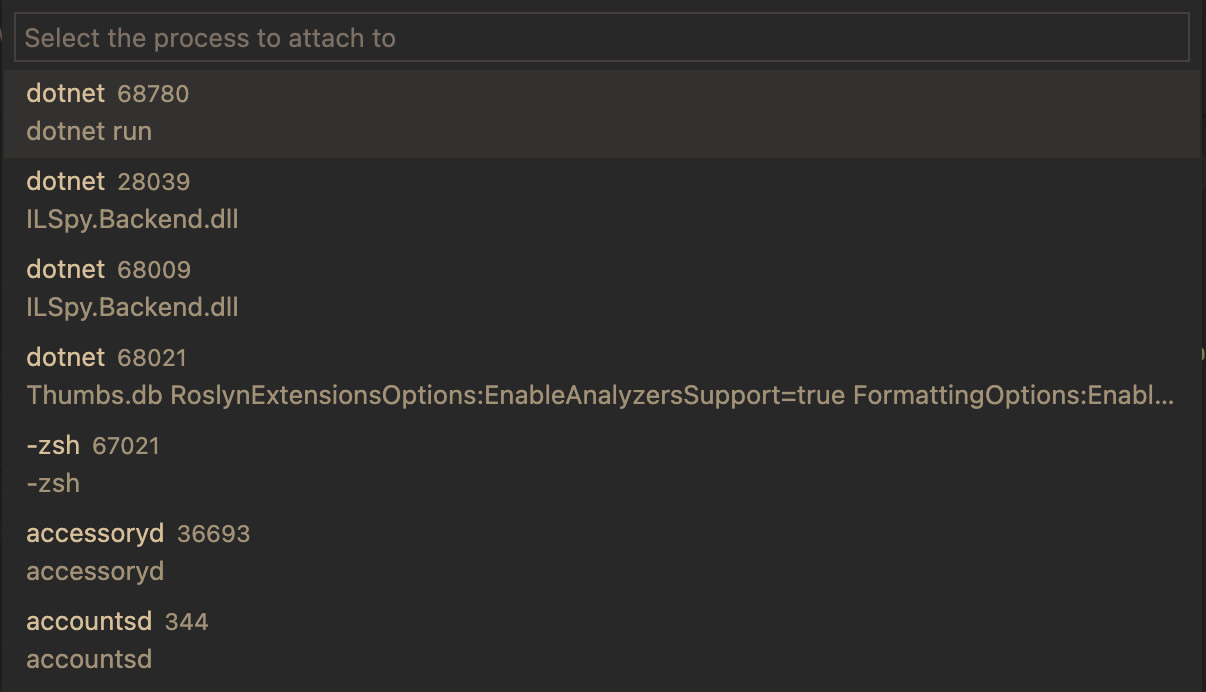
As we have been going through these configurations you may have noticed a default configuration with a request type of "attach". This configuration can be helpful if a process was started outside of VS Code, but we want to debug the application in that running process from VS Code. This can be done by running the "attach" configuration. When we select the default ".NET Core Attach" configuration, a dialog box will show up for us to select a process to attach to. Before debugging the app we can open up a terminal to the root of our project directory and run the following command.
dotnet run
This will run our application. We can then debug the application with the "attach" configuration. A dialog box will be displayed and we should see the process in the dialog. VS Code's UI is helpful in showing the command that started each process. In our case, we'll be looking for one that includes dotnet run, which is the top option in the screenshot below.
With all of this information, we should have a pretty solid foundation to begin debugging .NET applications in VS Code. If you'd like to learn more about the general debugging features in VS Code, I highly recommend checking out the docs here.